VMWare network performance bug - Getting a repro
If you’ve read my previous post about an issue with VMware ESX 6 and connecting to SQL and 500ms latency, you might be interested in the process we went through to get to the repro.
Getting a repro (being able to reproduce a bug/feature) is often a complex and time consuming task. The challenge is like being Sherlock Holmes and using your experience to focus on the aspects of the situation that is important. The challenge is that without a repro,
- You can’t give anything to a supplier to enable them to triage and find a fix for it
- You don’t know the scope of the issue and if its something affecting other areas that you don’t yet know about.
In the situation with VMware we had other issues that we thought could be because of this issue and thus wanted to understand the problem more and why it was so transient.
We therefore decided to dig.
Why and When?
Whilst we now know the cause I really wanted to figure out what was going on. We could replicate using one of our apps, but that was using multiple layers with the end result being JDBC.
I was determined that I could get this down to a simple repro not involving any 3rd party app.
The process consisted of extracting the SQL in the repro from profiler and then taking it apart to find what was causing the problem.
The issue always seemed to occur with one query and that was pulling back a resultset with a large number of columns.
Hypothesis 1 – Its the number of columns
I change the query that was having the problem to return less columns and eventually the problem went away. Given the goal was to simplify and remove the 3rd party app I change the query to just return a result set of based on selecting constants, i.e. not from a table.
SELECT NULL as column1, NULL, as Column2 …….
This didn’t have the same result. I just couldn’t get it to exhibit the 500ms latency -
Hypothesis broken.
Hypothesis 2- Its the amount of data
The next step was related to the first. Receive side scaling is all about optimising the. I’ve seen issues before when data goes above certain levels. You end up in a different code path and thus get different behaviour. This is seen when you pass parameters to a stored proc, up until a certain level data is held in memory, after that data has to spill to disk to avoid overloading the server, imagine 1000 requests sending in 100Kb parameter values, that's 100MB of memory just for parameter values. This behaviour gives you a step jump in performance. The crux is that as data volumes increase you can hit new code paths and that's what I expected here.
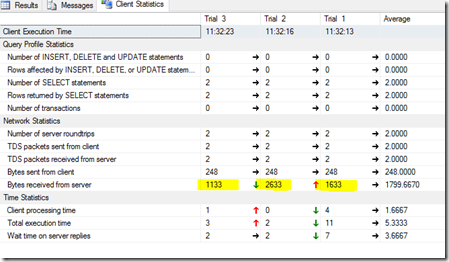
Management studio has a really nice feature that I see hardly anyone use and that is Client Statistics. You can enable it by clicking a button on the toolbar. When enabled it gives you all sorts of information like where the time is spent in your query, is it waiting for results from the server or the waiting for data to be transferred. It also gives you stats about the bytes sent to and received from the server. Perfect
I went back to the queries from step 1 and ran the different queries that worked and didn’t work and checked the bytes sent and received.
Whats really neat is that the stats are shown side by side for an execution. This means you can easily compare.
What I found was that when the bytes received hit over ~ 1500 then the problem occurred. Magic.
Now to simplify it.
I tried different things, looking at different columns and column name lengths, and query lengths, with the end result being able to reduce the query down to a really simple query.
SELECT replicate ('v',1000) A
I could change the length passed to replicate to get a bigger result sets. So nothing to do with column names, or number of columns, just the size of the resultset.
I was however then struck that the problem went away.
Hypothesis – plausible
Hypothesis – its volume of data and volume of requests
Extending the query further I thought it was something to do with load, I threw the query into powershell, and I found that when the problem went away, if you hammered the system for a while it came back.
Throwing this into a powershell script enabled me to reproduce the issue on demand.
We now had a repo we could fire against any system from any system and figure out if the problem existed. Importantly this enabled us to test against SQL on a non windows 2012 server and pin point this down to the receiving OS. Pretty obvious really, but now we had proof.
Hypothesis – Confirmed
![image_thumb[2] image_thumb[2]](https://siodataprodweu.blob.core.windows.net/cmsassets/Open-Live-Writer/d7fc76c9fd1a_A30A/image_thumb[2]_thumb.png)
