Automating SQL Server Performance Testing
You run performance tests as well as functional tests when deploying new code changes to SQL Server, right? Not many people do, I think you should, and this article will show you how to do it by harnessing an existing performance tool, rather than writing your own monitoring infrastructure from scratch.
Any good performance monitoring tool that records information to a database will do fine, and we prefer to use Sentry One.
Here are the steps to accomplish this.
Create a baseline database
When you release your database change, you want to have something to compare against as an acceptable baseline. We have created a stored procedure in a separate database to SentryOne which accepts the following parameters
- TargetServerName
- StartDateTime
- BaseLineDuration (secs)
We are capturing Avg, Min and Max values from the following metrics, but you can capture whatever you want from the vast selection in the SentryOne database.
% Processor Time
Batch Requests/sec
Checkpoint pages/sec
Forwarded Records/sec
Lazy writes/sec
Network Bytes Read
Network Bytes Written
Page reads/sec
Page writes/sec
Probe Scans/sec
SQL Compilations/sec
SQL Re-Compilations/sec
This proc runs in a separate database to Sentry one, that we’ve called SabinIO.
Build a pipeline
Obviously the database you want to make code changes to is source controlled as an SSDT project! ![]() A build of this project should produce a DacPac, which is a model of how you want the database to look in terms of database objects. This dacpac should be released in your pipeline to your environments. As a minimum you will need a Performance test environment and Production, but you will most likely have four or more. You will probably have Development, IntegrationTest, PerformanceTest/PreProd and Production.
A build of this project should produce a DacPac, which is a model of how you want the database to look in terms of database objects. This dacpac should be released in your pipeline to your environments. As a minimum you will need a Performance test environment and Production, but you will most likely have four or more. You will probably have Development, IntegrationTest, PerformanceTest/PreProd and Production.
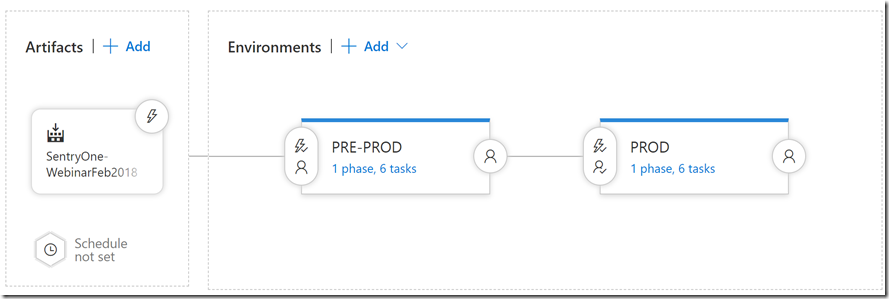
We have a demo pipeline that looks like this for our demo releases.
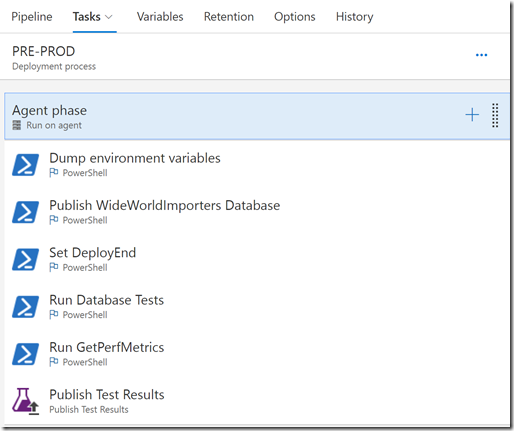
The Pre-Prod steps look like this:
- Dump environment variables. This lists our all the environment variables for debugging purposes. Not necessary
- Publish WideWorldImporters Database. This deploys the dacpac to the target server in your PreProd/Performance Test environment. Essentially deploying the change you want.
- Set DeployEnd This sets a variable to record the end time of the deployment which will be used later for the performance test comparison
- Run Database Tests This step calls a PowerShell Script to run Pester tests. These are both functional tests and Performance tests. This is the crucial step in the whole process that will wait a few minutes (configurable) for the effects of the deployment to manifest themselves. Once this has occurred, the data in Sentry One is compared against the baseline, and if any metrics fall outside of the configurable thresholds, the test is marked as failed.
- Run GetPerfMetrics. This step gets the performance data so that it can be displayed in our VSTS Extension as a chart. Handy for release and dev managers that don’t have access to the Sentry One client.
- Publish Test Result Simply publishes the test results of the Database Tests to VSTS so they can be viewed in case of failure.
Deploying a harmful change
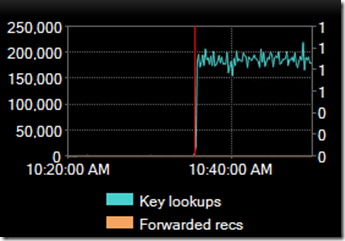
If I deploy a harmful change which results in high CPU and high Key lookups, the Sentry One client shows data like this:
We can see straight away in the Sentry One client that the deployment was harmful. The deployment was done where the red line is on the chart. As a development manager if you don’t have the Sentry One client, you could simply look at the test results and you would see the following.
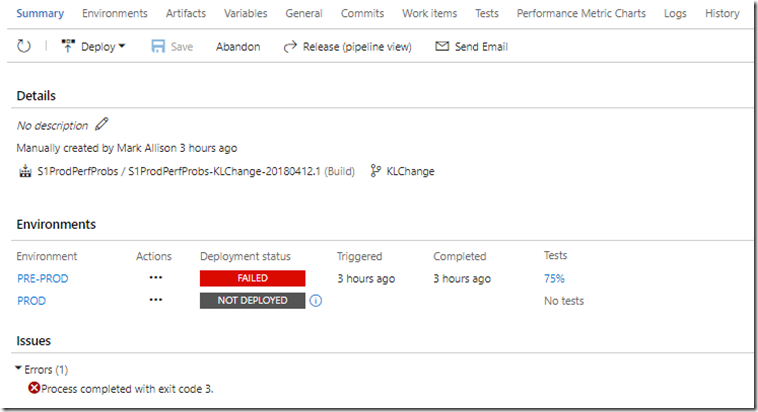
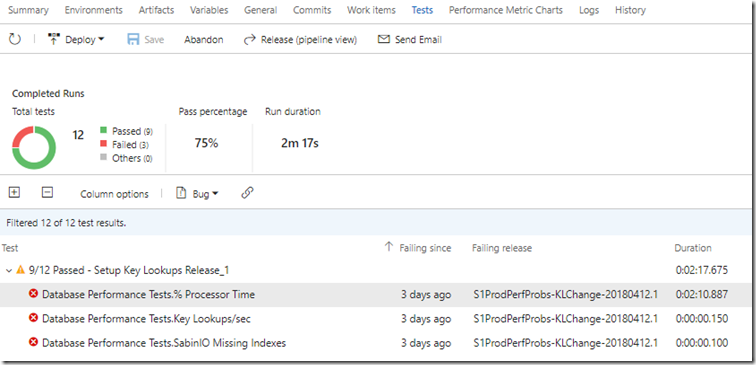
Clearly we can see here that the PRE-PROD release was failed, and that only 75% of the tests passed. Let’s look at the test results now.
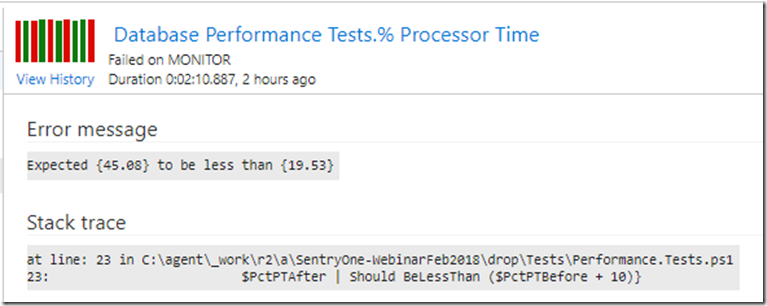
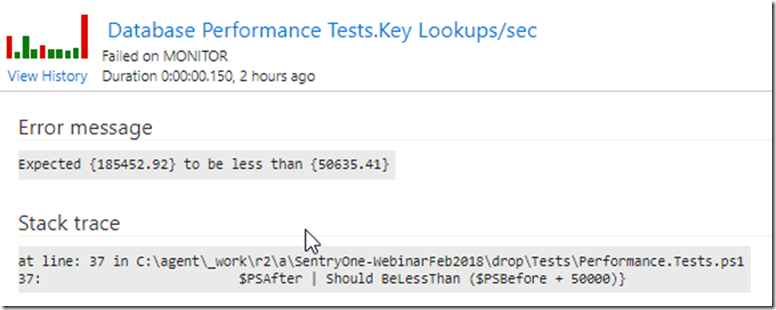
Three tests failed with high CPU, high Key Lookups and Missing Indexes detected. These are simply Pester tests in PowerShell which look at data in the SentryOne database and compare them against the baseline data we took earlier. If we drill into a couple of these we can see more information:
Here we can see that Processor time should have been averaging less than 19.53% after deployment, but it was 45%. This is not good, something has caused high CPU over an extended period so we want to fail the release and investigate before it gets to Production! Also, we can see that Key Lookups are now very high, much higher than acceptable levels.
VSTS Extension
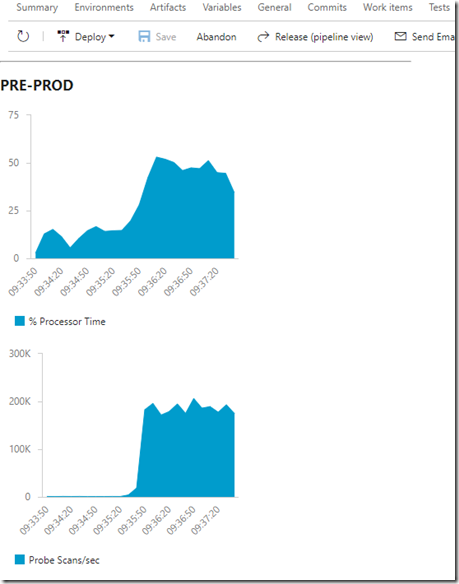
You have a lot information right there in the VSTS test output, but if you want to visualise the data and see for yourself how the CPU and Key Lookups look on a chart, we created a VSTS Extension to do that. It looks like this:
If you compare the above chart to the Sentry One charts from earlier on, you can see that they are very similar. Very handy to have for easy diagnosis. The VSTS Extension is private at the moment but if you would like to see it please get in touch at mark.allison@sabin.io or hello@sabin.io
How to fix
We have a bad release, we prevented it from getting it to production, and we know exactly what the symptoms were of the release before our users had to experience it. The process we follow to fix this is to:
- Create a JIRA ticket or VSTS Work Item highlighting the problem.
- Create a New Branch in our Git repo
- Develop a fix in SSDT – in this case we probably need an index with included columns.
- Run our functional tests locally in PowerShell to make sure we haven’t broken something else.
- If all good, commit our change and push our code to VSTS for code review with a Pull Request.
- If our branch builds and releases with no issues, then merge the PR into development or master branch.
- The merged code will then proceed along the pipeline, but this time will have the performance tests run. If they pass, we can set an Approval gate for release to Production.
Conclusion
As a developer that writes database code, start getting into the habit of writing tests. Once you’ve done it for a while they don’t take long to do. They will save your bacon one day! You will have reliable releases. Consider using a performance tool like Sentry One to monitor a performance test environment so that you have access to a rich set of metrics to run tests against. Make sure you have a production-like workload running in your performance test environment otherwise your tests will be meaningless. This is a topic for another blog post!
The key message here is Automation. Here we have automated our functional tests, our performance tests, our build, the release and gathering of performance data. All a developer has to do is write database code, functional tests and push to git and VSTS and PowerShell does the rest.
